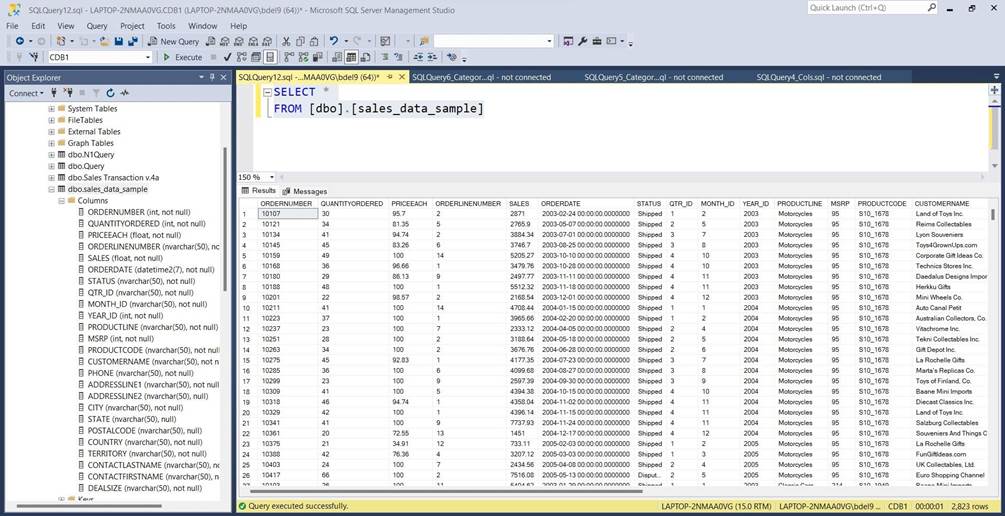
This SQL project includes the SQL Queries I executed in SQL Server Management Studio 2019 to perform Exploratory Data Analysis of this Sales dataset from Kaggle, the results will be used later for my plots, data visualizations and dashboards in Tableau
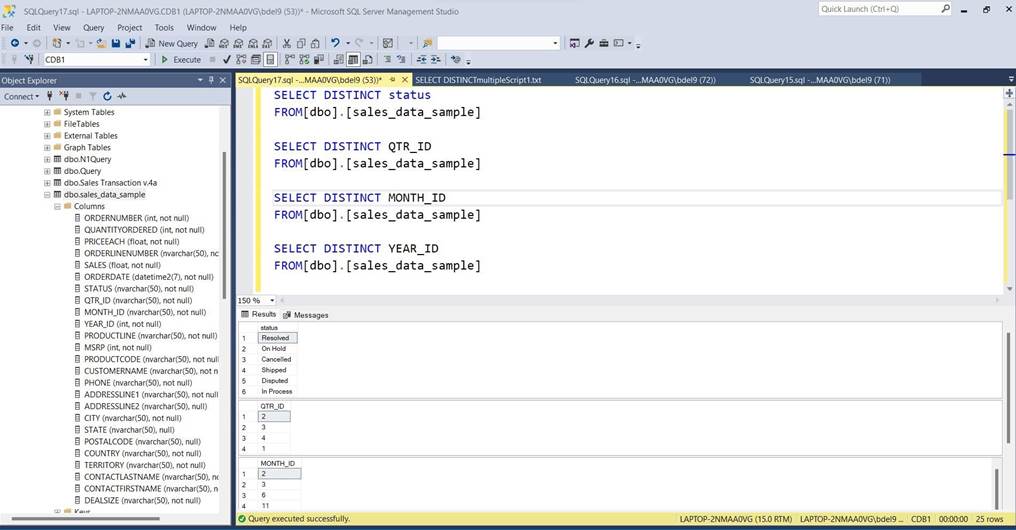
Executed these SQL SELECT DISTINCT statements above to retrieve a Unique list of values for the following fields: Status, QTR_ID, MONTH_ID, YEAR_ID
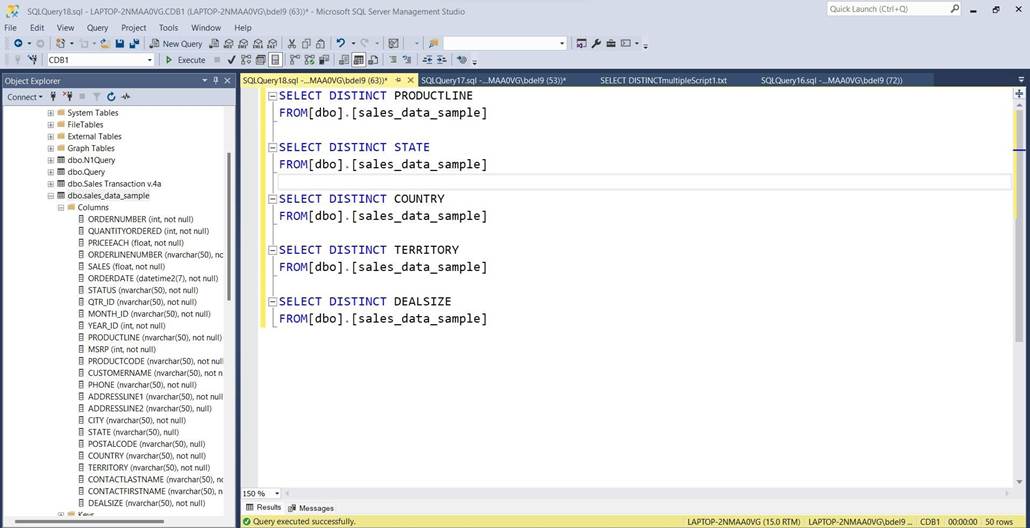
Executed these SQL SELECT DISTINCT statements above to retrieve a Unique list of values for the following fields: PRODUCTLINE, STATE, COUNTRY, TERRITORY, DEALSIZE
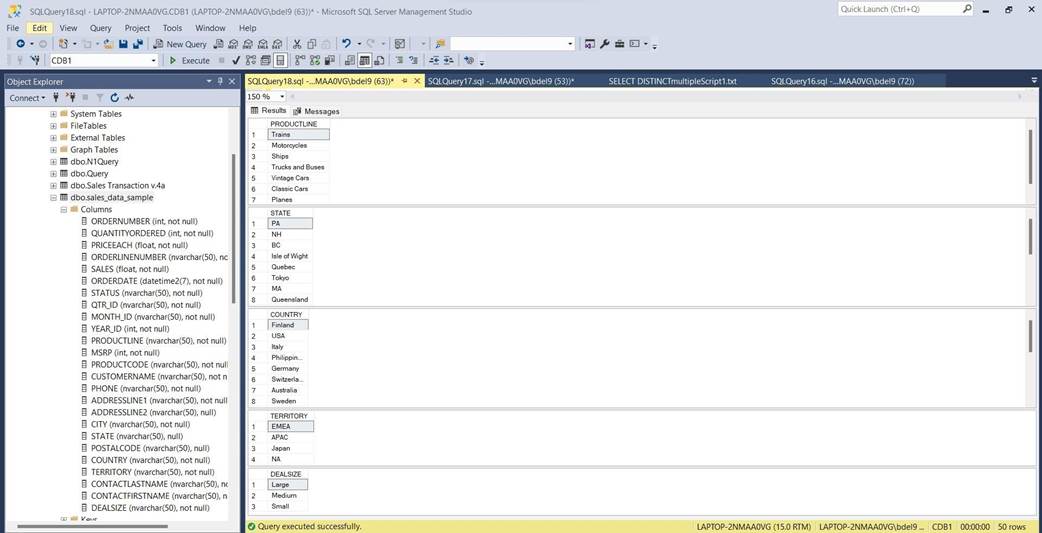
Query Results - SQL SELECT DISTINCT statements. Fields: PRODUCTLINE, STATE, COUNTRY, TERRITORY, DEALSIZE
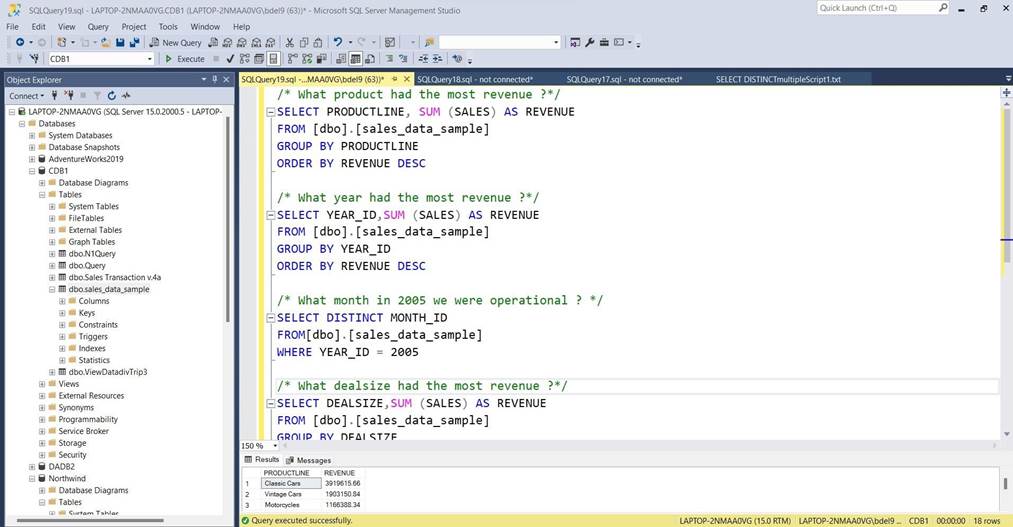
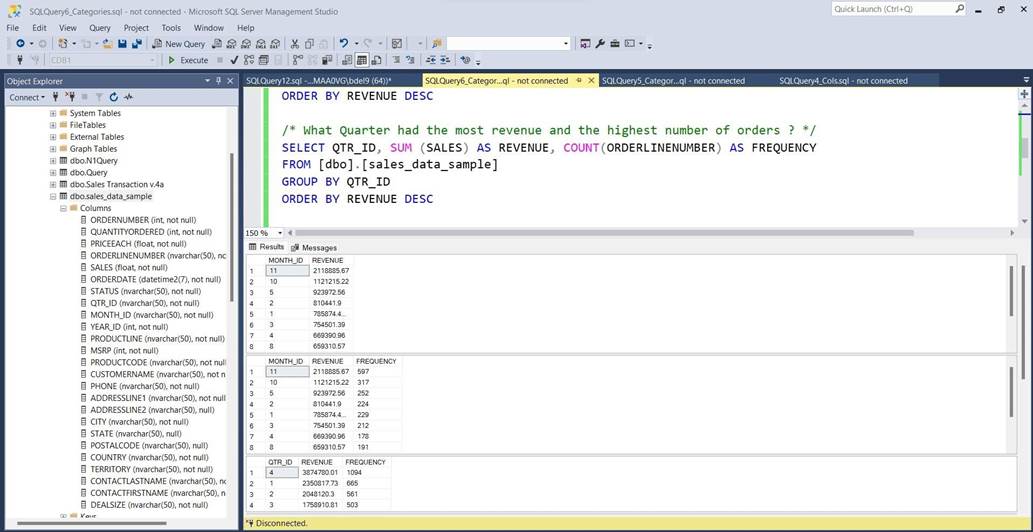
These SELECT statements above group, summarize and sort the data in descending order to answer questions about : PRODUCTLINE, YEAR_ID, MONTH_ID, DEALSIZE, REVENUE
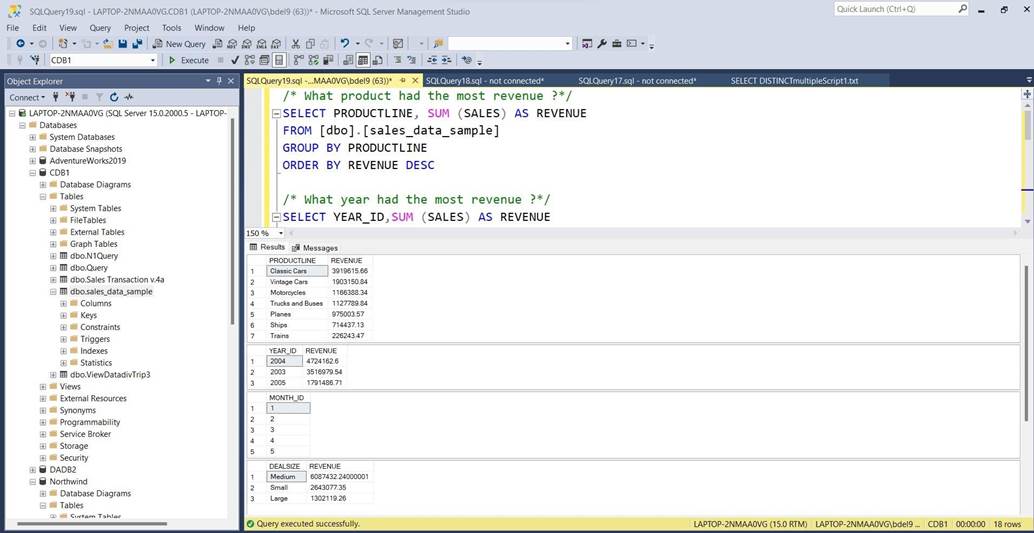
Query Results for the previous SELECT statements which group, summarize and sort the data in descending order to answer questions about : PRODUCTLINE, YEAR_ID, MONTH_ID, DEALSIZE, REVENUE
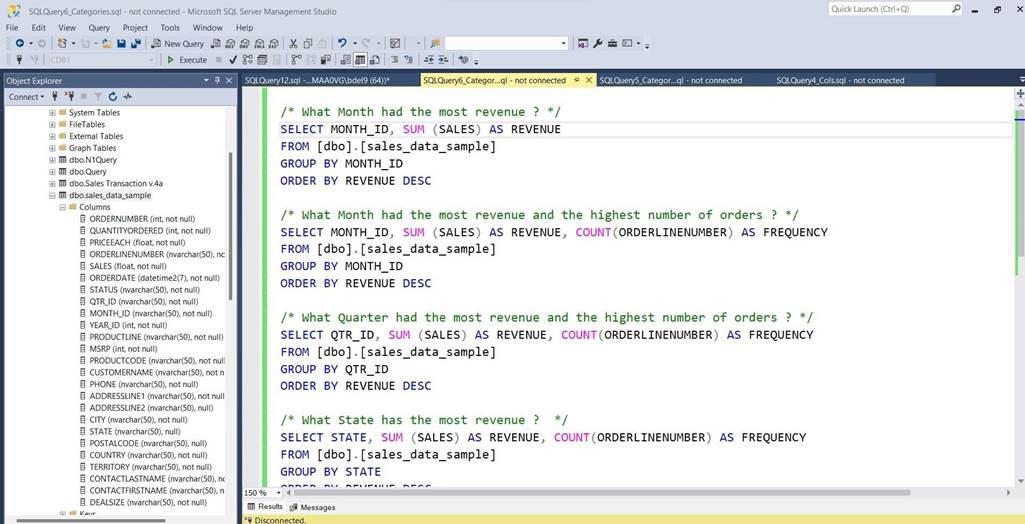
Grouping, summarizing and sorting the data in descending order to answer questions about : Month_ID, QTR_ID, STATE ind descending order.
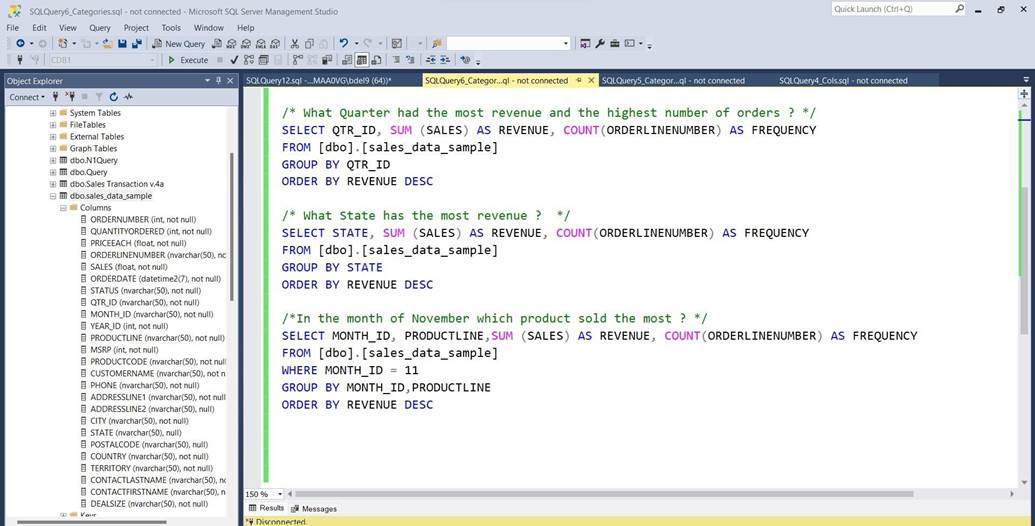
Grouping, Summarizing, Counting, Filtering the data for a specific month and sorting the data in descending order to answer questions about : Month_ID, QTR_ID, STATE, PRODUCTLINE.
Query Results for the previous SELECT statements. - Grouping, Summarizing, Counting and Filtering the data.
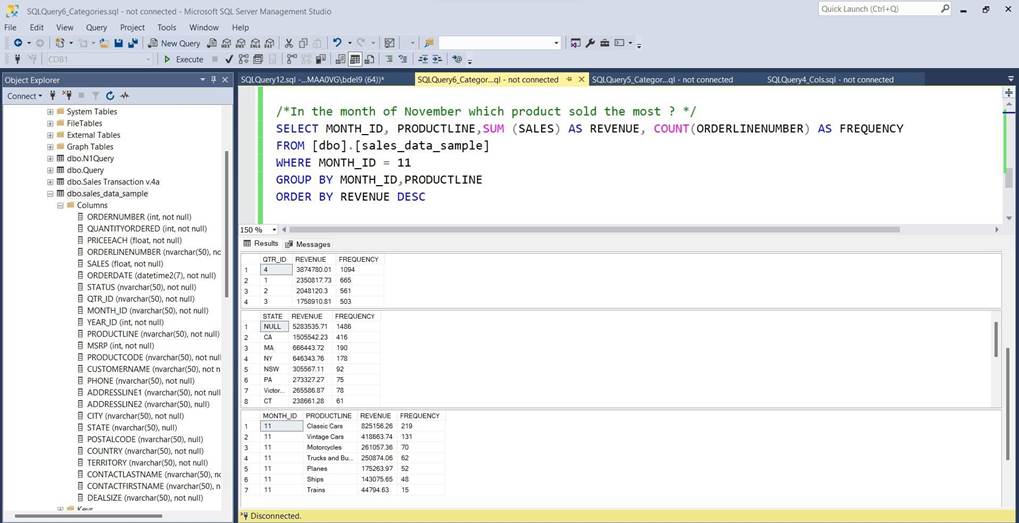
Query Results continued for the previous SELECT statements. - Grouping, Summarizing, Counting and Filtering the data.